

US500: A further correction towards 5192 before resuming purchases.
Bearish Scenario: Sales below 5220... Bullish Scenario: Buys above 5225 (if price fails to break below decisively) ...
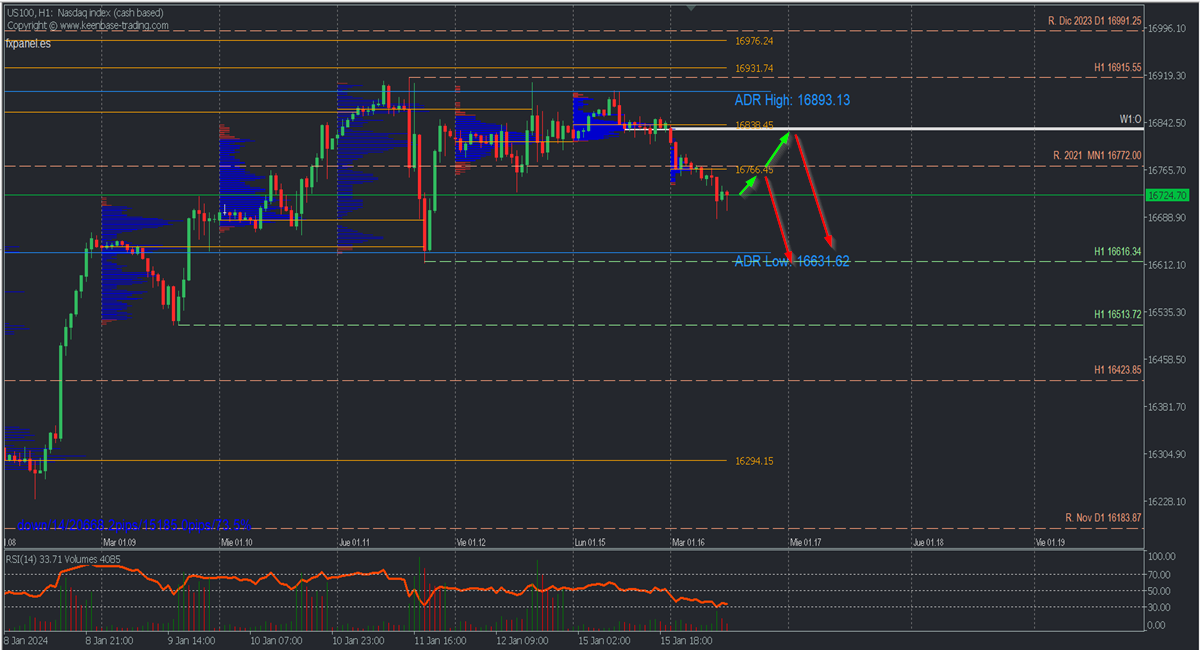
2024-01-16 • Updated
The price structure shows a bearish reversal pattern as it fails to create a new high and stays below the December resistance and the current historical high at 16991.25, leaving a series of uncovered selling zones (orange lines).
Monday's resistance, which today coincides with the daily bullish average range at 16893.13, also fails to create a new high. Therefore, a bearish continuation is expected with a target at the break of the 16615.70 support, near the bearish average range after the retracement.
Before the descent towards the indicated support, a brief rebound is expected in reaction to a buying zone from Thursday, January 11, heading towards the uncovered POC of the early sessions of the day at 16766, from where the selling will resume.
Only a decisive breakout (candle body) from the area around 16770 will extend the rebound towards the opening of the day and the week at 16835, which is also a selling zone expected to be defended by the bears. The RSI confirms bearish momentum by being in negative territory close to oversold.
*Uncovered POC: POC = Point of Control: It is the level or zone where the highest volume concentration occurred. It is considered a selling zone if previously there was a bearish movement from it. If previously there was a bullish impulse, it is considered a buying zone.
**Consider this risk management suggestion**It is crucial to base risk management on capital and traded volume. A maximum risk of 1% of the capital is recommended. The use of risk management indicators such as Easy Order is suggested.
—-----------------------------------------------------
Disclaimer
This document does not constitute a recommendation to buy or sell financial products and should not be considered as a solicitation or offer to engage in transactions. This document is economic research by the author and is not intended to provide investment advice or solicit securities or other investment transactions at FBS. Although all investments involve some risk, the risk of loss in forex trading and other leveraged assets can be significant. Therefore, if you are considering trading in this market, you must be aware of the risks associated with this product to make informed decisions before investing. The material presented here should not be interpreted as advice or trading strategy. All prices mentioned in this report are for informational purposes only.

Bearish Scenario: Sales below 5220... Bullish Scenario: Buys above 5225 (if price fails to break below decisively) ...

Bearish Scenario: Sell below 39600... Anticipated Bullish Scenario: Intraday buys above 39750... Bullish Scenario after Retracement: Intraday buys above 39150

Bearish scenario: Shorts below 18100 with TP1: 17900... Anticipated bullish scenario: Intraday Longs above 18130 with TP...

Jerome H. Powell, the Federal Reserve chair, stated that the central bank can afford to be patient in deciding when to cut interest rates, citing easing inflation and stable economic growth. Powell emphasized the Fed's independence from political influences, particularly relevant as the election season nears. The Fed had raised interest rates to 5.3 ...

Hello again my friends, it’s time for another episode of “What to Trade,” this time, for the month of April. As usual, I present to you some of my most anticipated trade ideas for the month of April, according to my technical analysis style. I therefore encourage you to do your due diligence, as always, and manage your risks appropriately.

Bearish scenario: Sell below 1.0820 / 1.0841... Bullish scenario: Buy above 1.0827...
FBS maintains a record of your data to run this website. By pressing the “Accept” button, you agree to our Privacy policy.
Your request is accepted.
A manager will call you shortly.
Next callback request for this phone number
will be available in
If you have an urgent issue please contact us via
Live chat
Internal error. Please try again later
Don’t waste your time – keep track of how NFP affects the US dollar and profit!
|


