Markets don’t always follow the usual rules, especially during uncertain times. One of the trickiest situations for traders is a liquidity trap, when the economy slows down and money stops moving. But how does that affect trading?
FBS turns 16
July 30, 2025
Basics
Markets don’t always follow the usual rules, especially during uncertain times. One of the trickiest situations for traders is a liquidity trap, when the economy slows down and money stops moving. But how does that affect trading?
In this article, you’ll learn what a liquidity trap is, how to spot one, and how it can change the way markets behave. We’ll also show real-world examples and share tips to help you adjust your strategy when the market feels stuck.
“Liquidity trap” is a term that comes from economics, where it means interest rates are near zero, but people still don’t want to spend or invest. So cash piles up, and the economy slows down. The idea came from economist John Maynard Keynes during the Great Depression.
In trading, it’s when the market looks active, prices move fast, but nothing’s really happening. You see fake breakouts, quick fades, and lots of sideways movement. Traders think a big move is coming, but nothing happens.
Sometimes, low-float stocks go up fast, and traders start shorting them, expecting a crash. But the stock doesn’t fall, it goes even higher and traps them. The same thing happens with breakout traders: they buy the move, but the price stalls. That’s the trap: money’s in the game, but no one’s really winning.
Liquidity traps change how markets behave, and traders need to be aware of it. The usual signals don’t push prices anymore. Volatility is low, prices don’t trend well, and traders may take less investment risk. This is called a “risk-off” market.
In this type of market, trading works differently. There are more fake signals and slower price moves. Knowing how liquidity traps work helps traders adapt, stay flexible, and spot new types of opportunities.
Start exploring complex markets with smart tools!
Catching the signs of a liquidity trap can be challenging, but there are some clear indicators that traders and investors can look for. These warning signs show that, even with lots of money in the system and very low interest rates, the economy isn’t picking up.
Below are some simple signs that a liquidity trap may be happening:
When central banks lower rates to zero or below, it usually means they’re out of options. If that doesn’t lead to more lending or higher inflation, it’s a warning sign that the economy may be stuck.
When long-term interest rates fall close to short-term ones, it means lenders don’t expect growth. This shows low confidence in the future.
Usually, when the Fed or ECB announces new support, markets respond. But if nothing happens, it shows their tools may no longer work.
If 5-year breakeven inflation rates fall, it means investors don’t think a stimulus will help. They expect weak growth to continue.
Central banks may add more money (like through QE - quantitative easing), but if banks don’t lend and people don’t borrow, that’s a strong sign of a liquidity trap.
Low interest rates on their own don’t mean it’s a liquidity trap. It becomes one when people stop investing and hold on to cash. That’s when the economy really slows down.
Liquidity traps are more than just economic theory. They’ve happened in big countries and lasted for years. We’ve gathered some of the most important and impactful examples from history:
After Japan’s economy crashed in the early 1990s, the country entered a long period of slow growth. The Bank of Japan cut interest rates to 0% and printed money (QE) to try to help. But the economy didn’t grow, it stayed under 1%.
Even in 2019, interest rates were still at -0.1%, the Japanese yen stayed strong, and the Nikkei 225 hadn’t recovered its 1989 peak. Despite many efforts, Japan’s economy showed little improvement for years.
After the 2008 crisis, the Federal Reserve dropped interest rates to almost zero and launched three big rounds of QE. But the recovery was slow, and inflation stayed low. Prices didn’t rise much, and the stock market only bounced back with strong help from the government, not just from lower rates.
The European Central Bank tried negative interest rates, money printing, and special loans to banks. Still, countries like Italy, Spain, and Greece had weak growth. Inflation didn’t pick up, and the euro stayed strong during tough times, showing that these actions weren’t enough to convince investors or change the market.
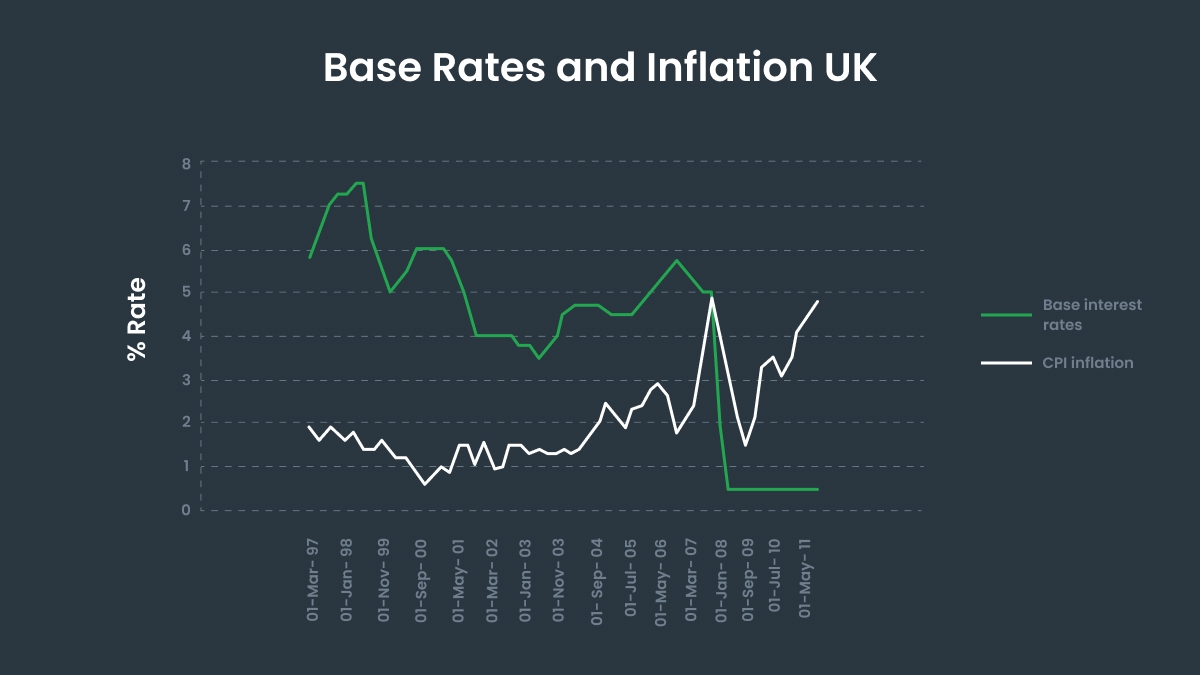
After the global financial crisis, the Bank of England cut rates close to zero and bought assets to help the economy. But lending stayed weak, inflation was volatile, and growth slowed. Even with super-low rates, prices didn’t settle.
Looking at past examples helps you see the warning signs early and make better choices before the market slows down.
When interest rates are near zero and stimuli don’t work, normal Forex trading patterns break down, and new risks show up. Here's what traders need to watch for:
When rates are low everywhere, carry trades don’t pay off. High-yield currencies like AUD and NZD lose their edge, and pairs like AUDJPY often stall or drop. Traders stop getting rewarded for holding risk.
In uncertain times, money flows into safe currencies like USD and JPY. Even bad U.S. news might not weaken the dollar. Safety matters more than the data.
Sectors tied to the economy (banks, autos, and materials), often fall flat. Investors play it safe, so momentum fades and prices move less.
Markets get quiet as central bank moves lose their punch. But fear builds under the surface, and surprise news can cause sharp jumps, catching traders off guard.
Rate changes and QE announcements don’t move markets like before. Traders shift focus to government actions like spending plans, infrastructure, and tax cuts, which have more impact.
Trading during a liquidity trap means the market often moves slowly, in random directions, or doesn’t follow the usual patterns. But that doesn’t mean you can’t trade, you just need to be more tactical. Here are some key tips:
| Market behavior | Tactical tip |
| Big breakouts usually fail, and trends don’t last long | Trade the chop, not the breakout: look for trades that bounce between support and resistance. |
| Central banks lose impact | Follow fiscal news, not just central banks: stimulus checks, tax cuts, and spending plans matter more. |
| Assets like USD, JPY, and CHF often get stronger | Watch safe-haven charts and risk signals like the VIX, DXY, and 10-year yields to time entries. |
| Moves can start and fail quickly; volume may disappear | Be ready for fake moves and slow action: overtrading hurts, so wait for clean setups. |
Liquidity traps don’t happen often, but when they do, they change the way markets move. Interest rates stay low, volatility gets smaller, and central bank actions don’t have much effect. In times like these, traders need to stop focusing only on central banks and start watching government spending, tax plans, and other fiscal news. Instead of chasing trends, it’s better to look for range setups between support and resistance.
If the Fed makes a big announcement and the market barely reacts, it’s not a sign of strength, it’s a warning. That’s when sharp traders find their edge by spotting the shift early.
FBS gives you the tools to trade smarter in low-volatility markets. Start now with FBS and take control!
By registering, you accept FBS Customer Agreement conditions and FBS Privacy Policy and assume all risks inherent with trading operations on the world financial markets.