You’ve opened a trade but are unsure what level to close it at. Does this scenario sound familiar?
Usually, the choice of target levels involves a lot of subjectivity. Many traders use indicators to determine more universal target levels. One of the simplest ways to do that is to use Pivot Points.
What are Pivot Points?
Pivot Points are significant support and resistance levels arrived at through specific calculations developed by professional traders on Wall Street (members of the New York Stock Exchange, who execute transactions from the Exchange floor exclusively for their account).
These traders are used to adapting rapidly to short-term changes in the market. At the beginning of the trading session, they looked at the previous day's high, low, and closing prices to calculate a Pivot Point for the current trading day. Then they calculated two support levels and two resistance levels. The levels were then used as key levels for that day’s trading. This is known as a traditional 5-point system.
How to calculate Pivot Points
Let’s look at the classic formulas for calculating Pivot Points.
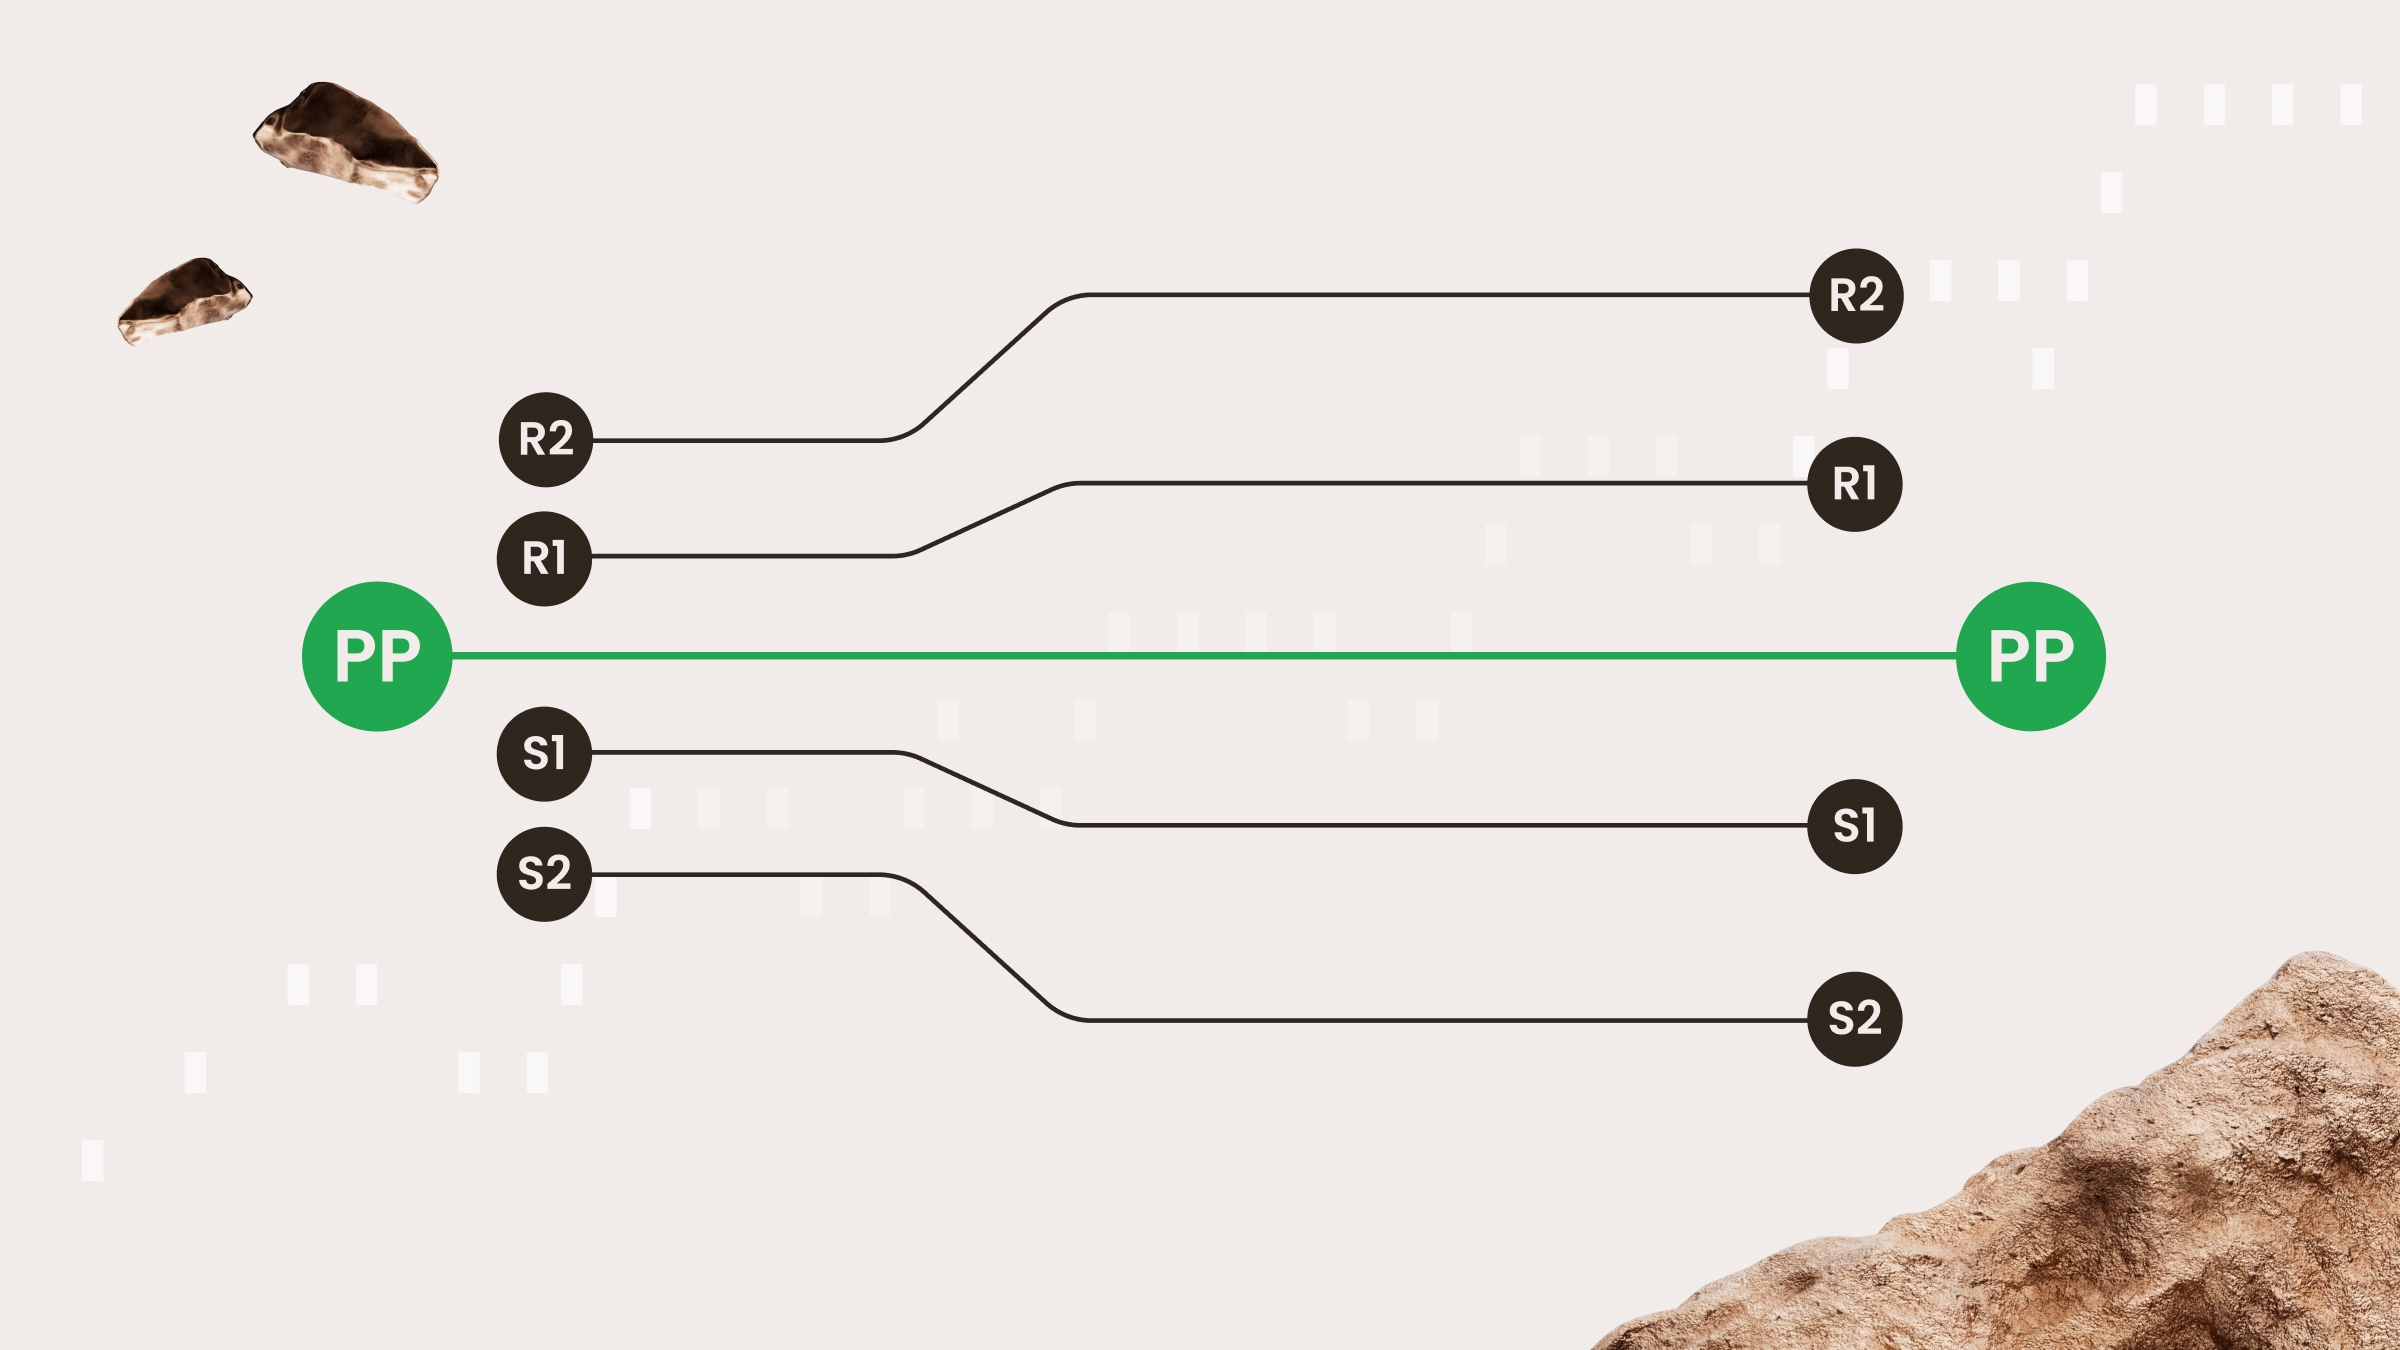
The most important Pivot Point (PP) is the central pivot. The central pivot is the primary support/resistance. That means the price is expected to float around this level most of the time. This is the basis for all other pivot levels.
The Pivot Point is calculated as follows:
Add up yesterday’s high, low, and close price, and divide the sum by three.
Pivot Point (PP) = (High + Low + Close)/3
— Support 1 (S1) = (PP x 2) – previous high.
— Support 2 (S2) = PP – (previous high – previous low).
— Resistance 1 (R1) = (PP x 2) – previous low.
Resistance 2 (R2) = PP + (previous high – previous low).
The classic 5-point system is one of several ways to calculate Pivot Points. There are also Woodie, Camarilla, and Fibonacci Pivot Points. These use different formulas to arrive at the levels.
Choosing a period
Pivot Point levels change depending on the period you choose. There are daily, weekly, monthly, and yearly Pivot Points.
Usually, daily pivots are used for trading on the M30 and shorter intraday timeframes. They use the previous day’s high, low, and close. These figures update every day.
Use the weekly Pivot Points on H1, H4, and D1 charts. To calculate these levels, take the previous week's high, low, and close. Note that these numbers do not change until the following week starts.
On weekly charts, we recommend you use monthly pivots. They take the data from the previous month.
Analyzing the monthly chart, you can apply yearly pivots. This approach looks at the high, low, and close of the previous year.
Using Pivot Points
There are a lot of strategies for using Pivot Points. Here are some of the most frequently used by traders.
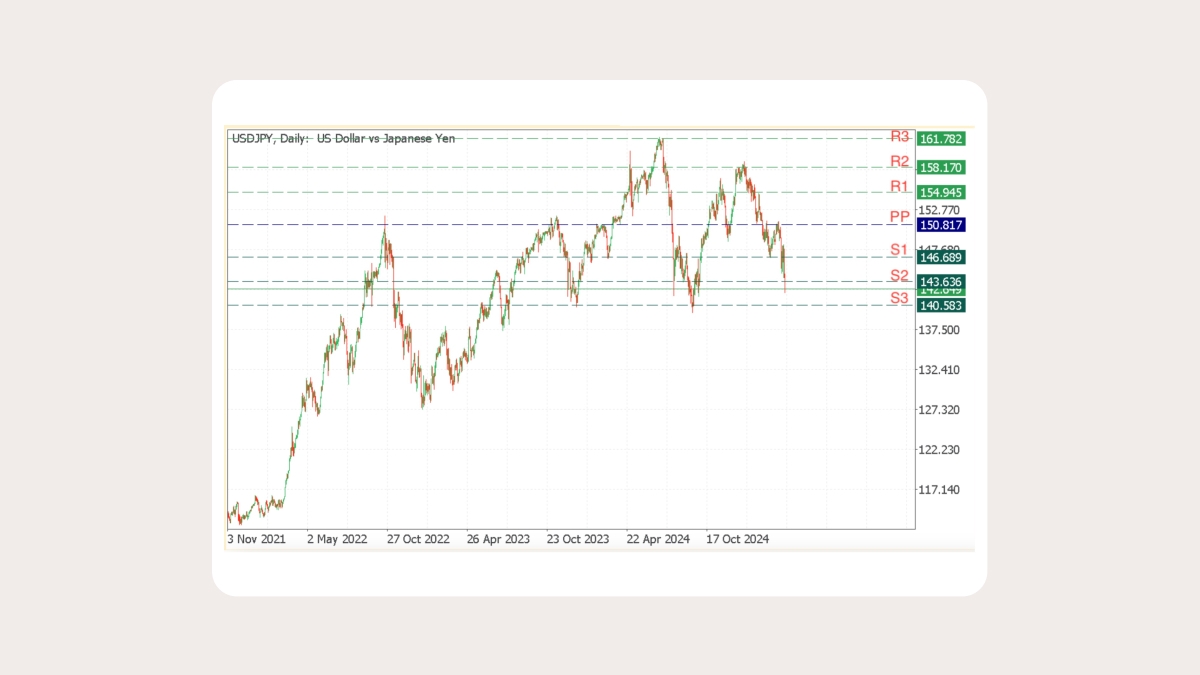
Support and resistance
Pivot Points can be used as traditional support and resistance levels. Rangebound Forex traders place a buy order near identified levels of support and a sell order near the resistance.
If the price moves toward the resistance level, you can place a sell limit pending order and a stop-loss just above the resistance.
If the price moves toward the support level, you could place a buy limit and a stop below the support.
Remember that support levels become resistance levels if the price is below them, and resistance levels become support levels if the price is above them.
Key levels
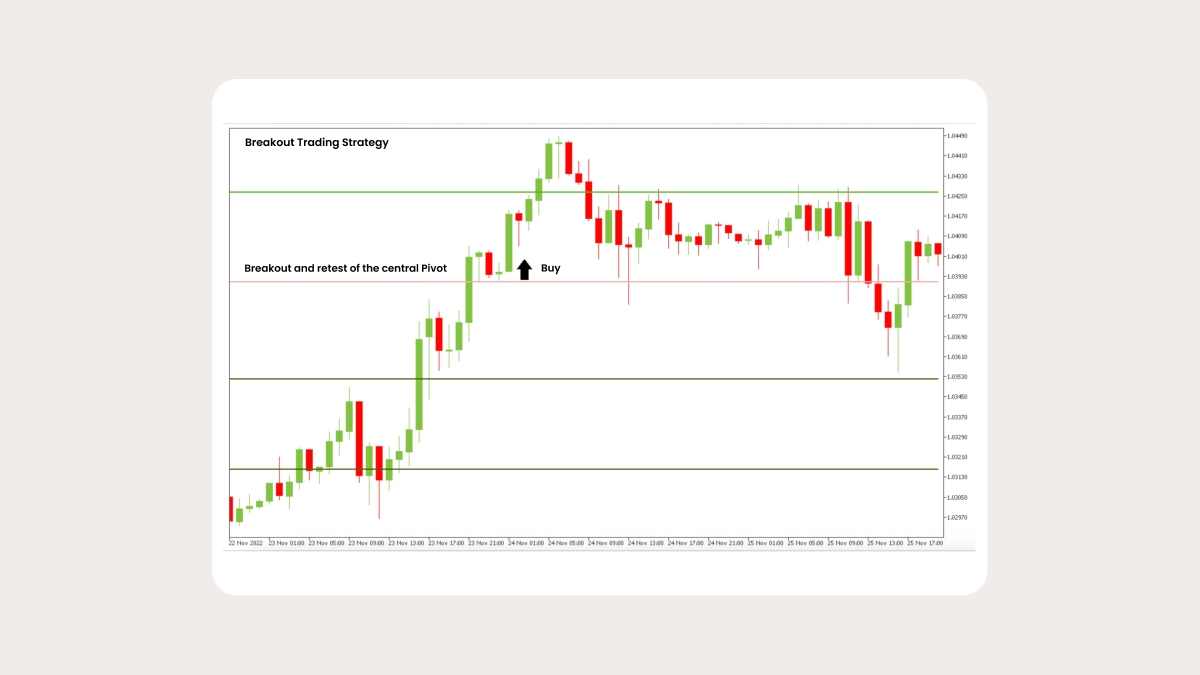
Breakout Forex traders use Pivot Points to identify the critical levels for a potential breakout. If the price crosses these levels, traders look forward to the upcoming price's direction.
If you see a strong bullish trend, you can wait until the pair breaks the first resistance. As soon as the pair breaks it, you can open a buy position and place a take-profit at the next resistance level. Remember the stop-loss, as well. Your stop-loss should be placed below the first resistance. If the price keeps rising, you can move your stop-loss manually.
If you see the price break the support, you can start selling the pair. The take-profit will lie at the following support level, and the stop-loss should be placed above the support the pair has broken. You can also move your stop-loss if you see the downward movement continue.
Be careful with this strategy, as it can be hard to determine in the moment whether it's a breakout or a fakeout. Spikes commonly happen during significant events, so keep up with breaking news and know what's on the economic calendar for the day or week.
Market trends
Pivots can help to identify overall market trends.
If the price breaks through the Pivot Point to the top, there are a lot of buyers on the market, and you should start buying the pair. The price falling below the Pivot Point would signal bearish sentiment and that sellers could have the upper hand for the trading session.
Market sessions
Another vital thing to know has to do with the market business hours.
As we know, the Forex market functions 24 hours a day. There are four market sessions: Australia, Japan, the UK, and the USA. You can find the times for each of them here.
During the openings of each of the markets, there is a higher possibility of Pivot Point levels being broken as many traders enter the market simultaneously. When the US market closes and the Asian market opens, prices may remain stable for hours between the Pivot Point and either support or resistance. This provides opportunities for rangebound traders.
Download Pivot Points for MT5
MetaTrader's standard set of indicators does not include Pivot Points. FBS has developed a great tool to help FBS traders - Pivot Points for MT5.
You can download Pivot Points for MT5 from the MQL5 website.
To install Pivot Points on your trading platform, open MetaTrader and click File – Open a Data Folder.
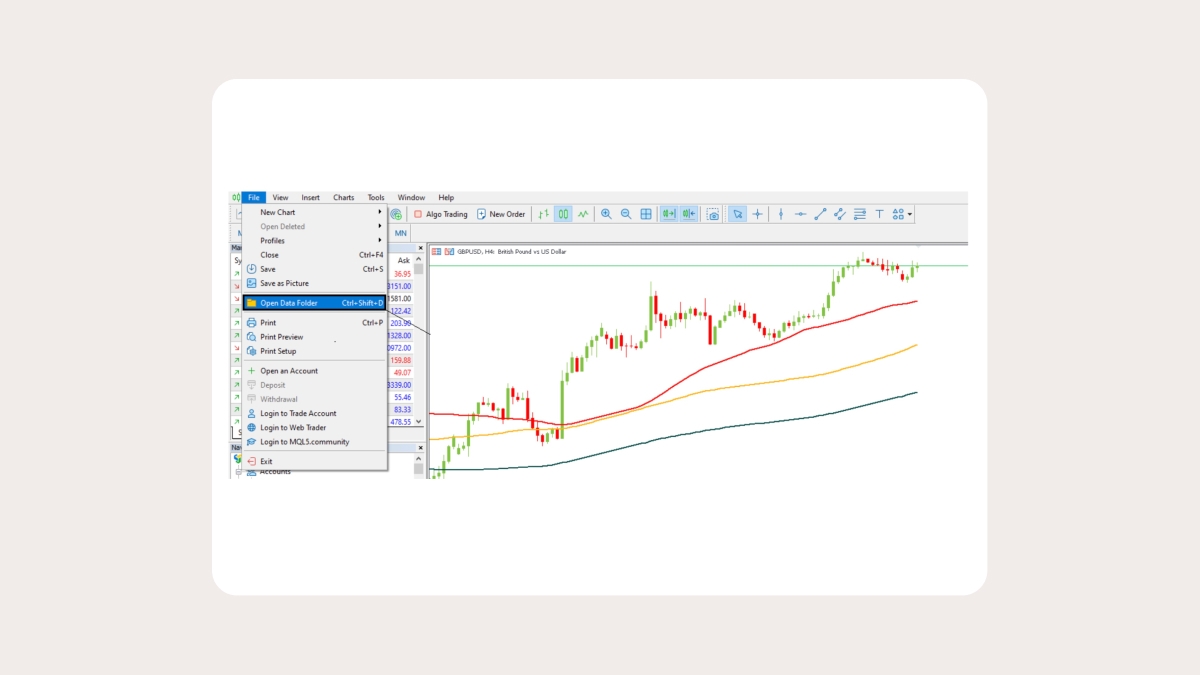
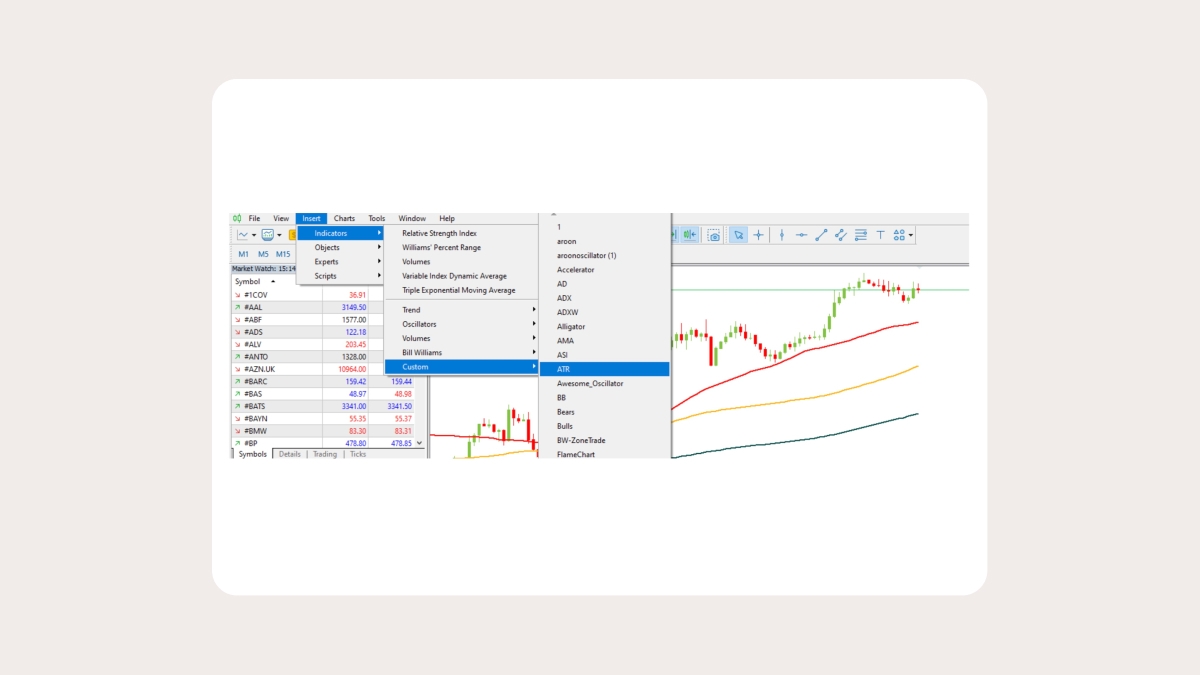
Place your mq5 file into this folder and reload MetaTrader. You can insert a new indicator in your chart by clicking Insert – Indicators – Custom.
That’s it! Now, you can take full advantage of the indicator in MetaTrader 5.
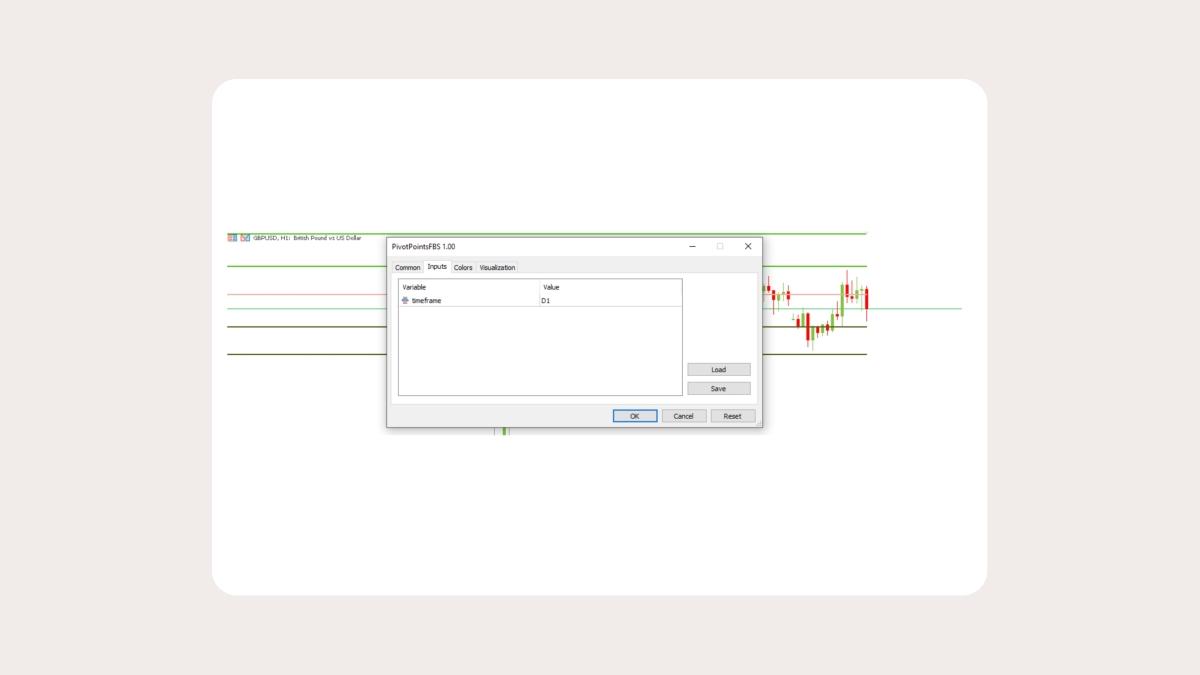
You can set the timeframe for Pivot Points in the "Inputs" bar. This variable can be adjusted later in the settings.
Summary
The Pivot Points indicator is helpful for traders in various ways. You can use it on its own, or in combination with other indicators. The latter option allows you to create and practice your unique trading strategy.