Let’s continue our study of technical indicators developed by Bill Williams. The Market Facilitation Index (MFI) measures the strength or weakness behind price movements. As implied by its name, the idea of the indicator is to make trading easier for you. Using the MFI will help you determine 3 important things:
whether the current trend is strong enough to trade it;
when a new trend may start;
when it’s better to avoid trading.
To add it to your chart in MetaTrader, click Insert, choose Indicators, Bill Williams and then Market Facilitation Index.
How to use the Market Facilitation Index
The MFI combines changes in price (range) and volume. Here’s its formula:
MFI = (High – Low) / Volume
The indicator has bars of 4 colors. Each color has a specific meaning and shows how the market responds to a change in volume.
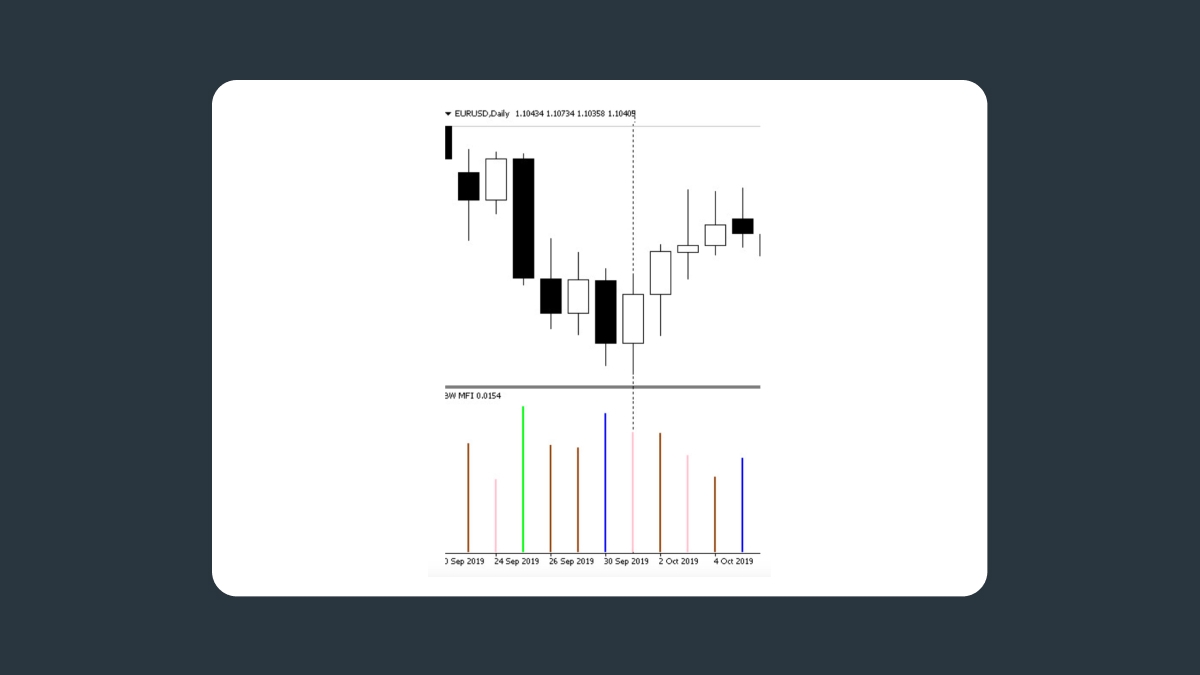
Green. A green bar forms if both MFI and volume are up. It means that more and more traders are joining the market in the current direction. In other words, it points to a strong trend, and you can open trades in line with it.
Brown. A brown bar appears when both MFI and volume are declining. It is also called a “fade” and signals that traders are hesitating and don’t want to continue the trend anymore. Joining the trend is not recommended. Several brown bars are a sign of the potential reversal of the trend.
Blue. A blue bar forms when MFI increases, but volume declines. A spike in price may be short-lived and precede a change in the trend. Blue bars appear when newbies enter the trend, but professional traders remain wary.
Pink. A pink bar, also known as a “squat”, appears when MFI is diminishing, but volume is growing. It reflects an increase of trading interest and an active fight between buyers and sellers. After one of the sides wins, the price will likely make a big move breaking support or resistance levels. The MFI cannot, however, be used to determine the direction of the breakout.
How to trade using the MFI
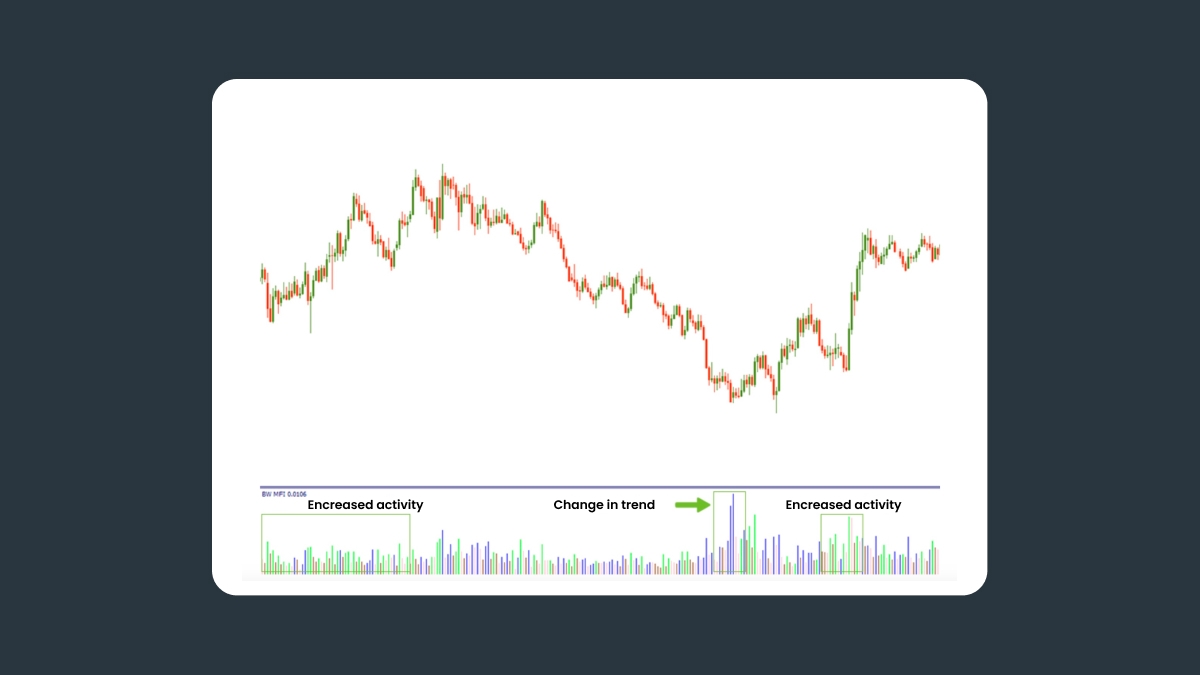
The colors of MFI bars provide traders with important information about the market. Green or pink bars that correspond to increasing volume usually signal a trading opportunity. You can also compare the indicator’s bar with the preceding one to see whether conditions for trading are becoming better or worse.
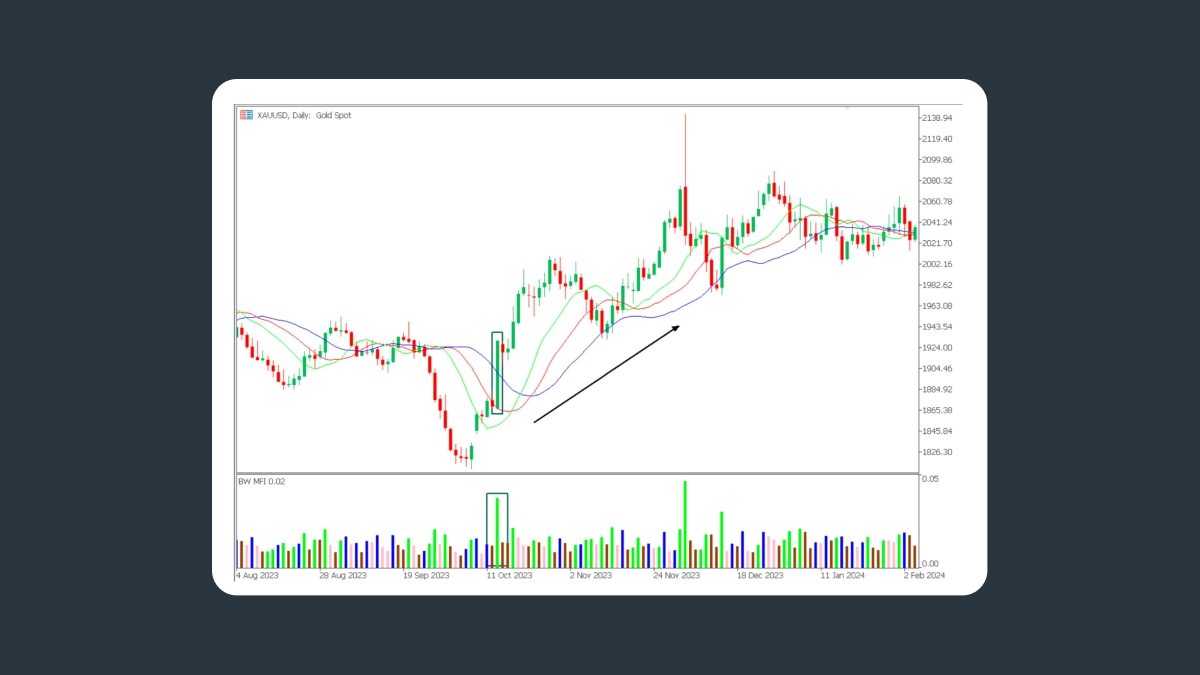
The example above shows a strong green histogram coinciding with a green candlestick and signaling the beginning of an uptrend. Williams’s Alligator indicator confirms the strength of this trend.
Like many other technical indicators, it’s not the best idea to make trades on the basis of MFI alone. Bill Williams advised combining MFI with Fractals and other indicators, such as the Alligator or Moving Average.
Summary
The Market Facilitation Index (MFI), developed by Bill Williams, helps traders assess the strength of a trend, identify potential reversals, and know when to avoid trading. The indicator combines price range and volume and uses color-coded bars to provide market insights. Green bars signal strong trends; brown bars suggest hesitation or potential reversal; blue bars indicate short-lived price movements; and pink bars show increased market interest before a potential breakout. For more accurate trading decisions, the MFI is best used in conjunction with other indicators, like Fractals or the Alligator.